Mapping Radiation with a Raspberry Pi GPS Scintillation Detector

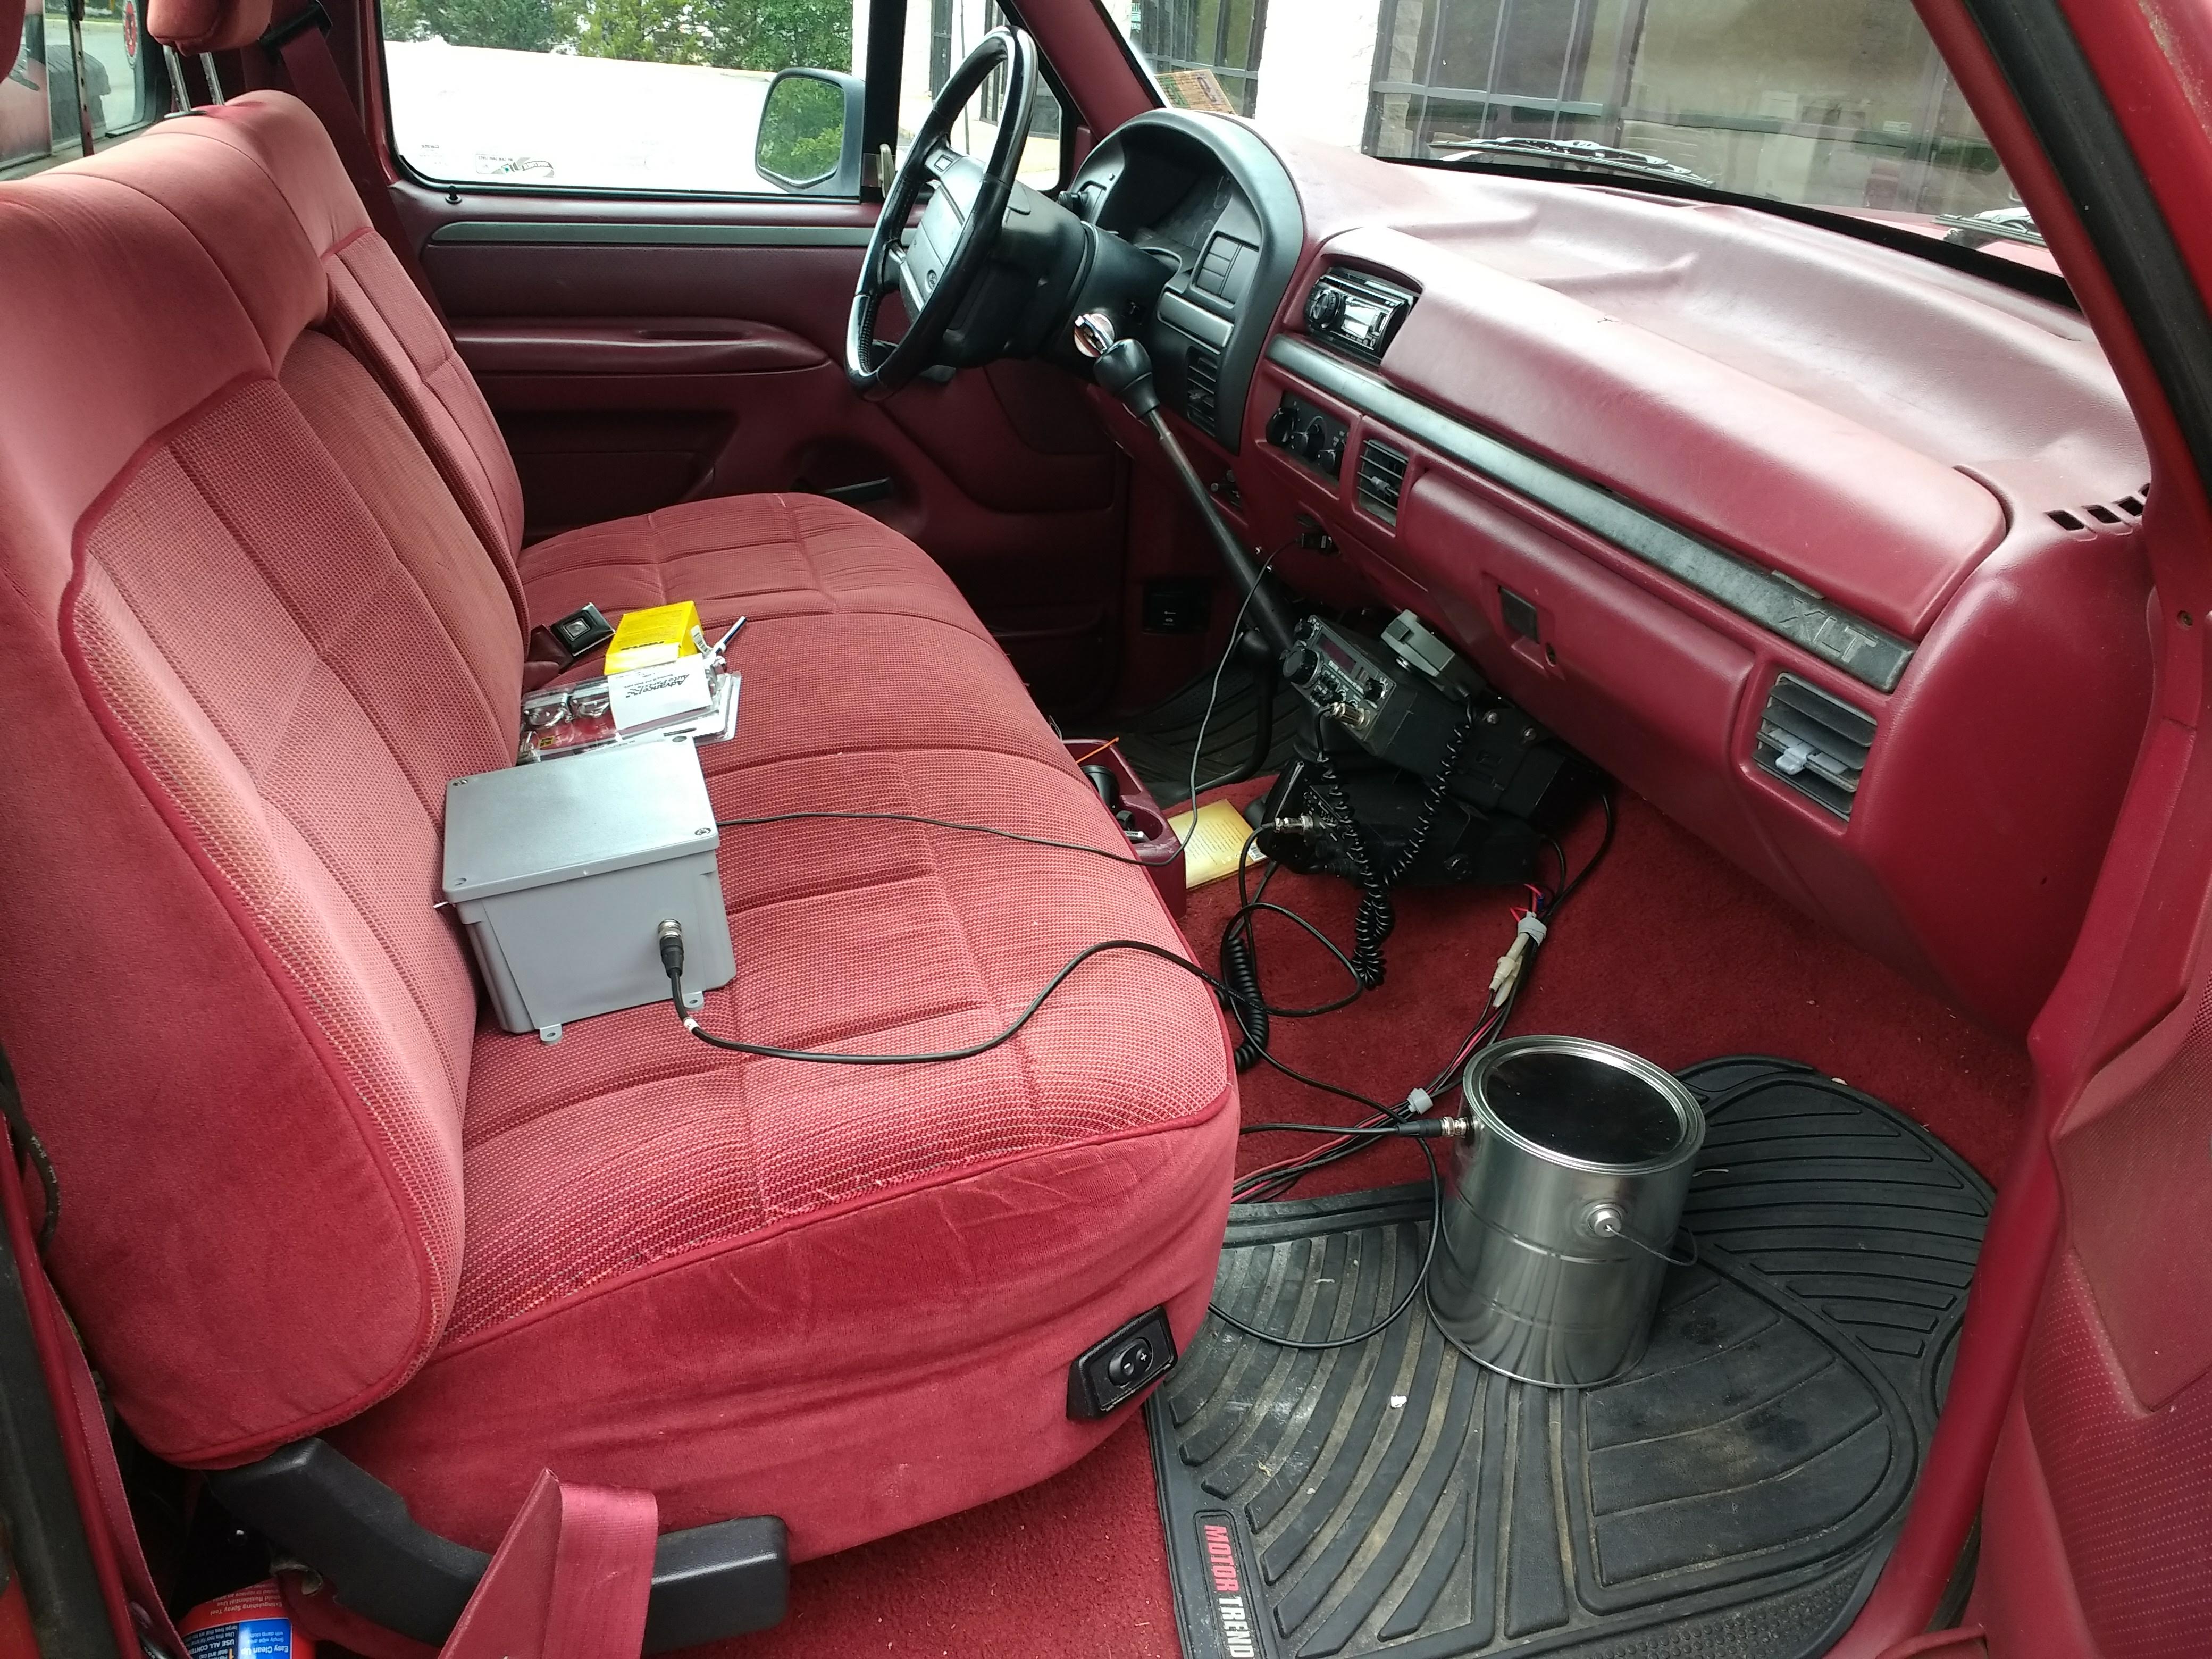
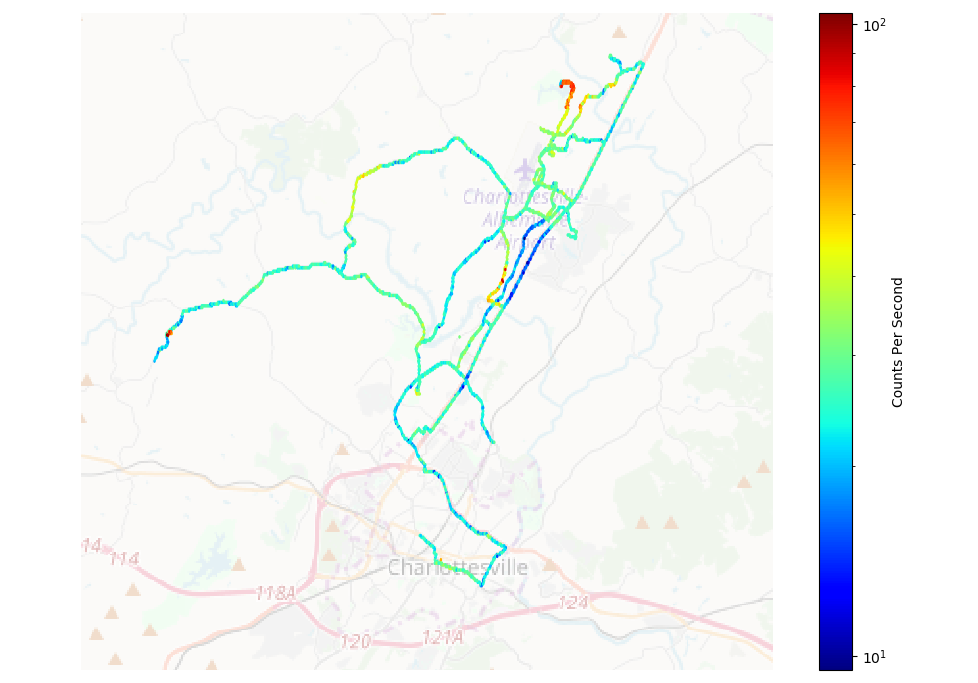
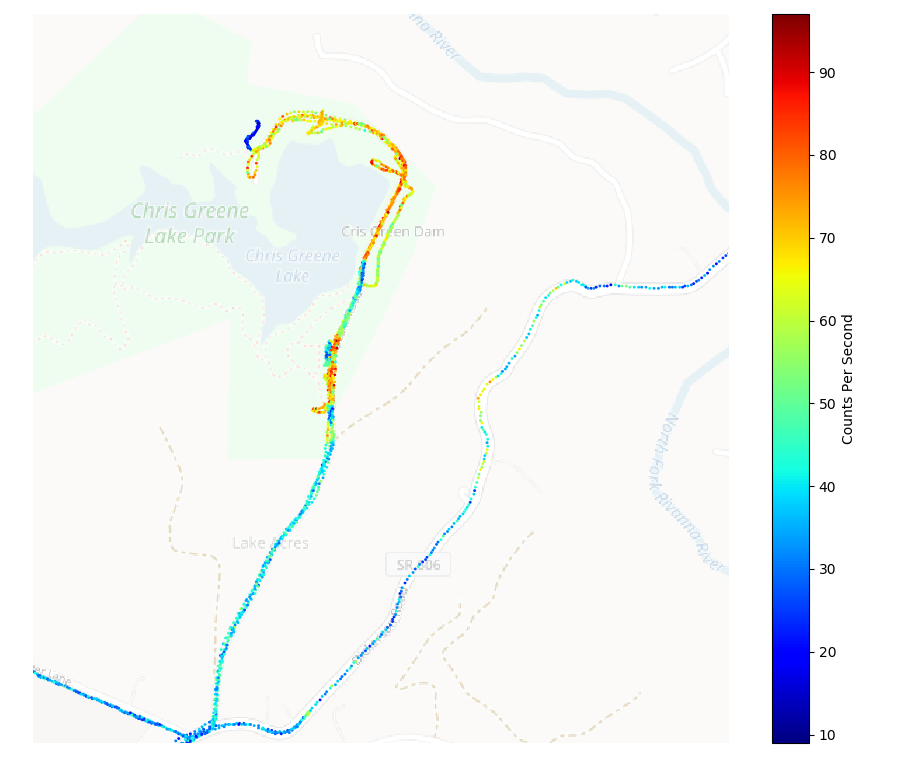
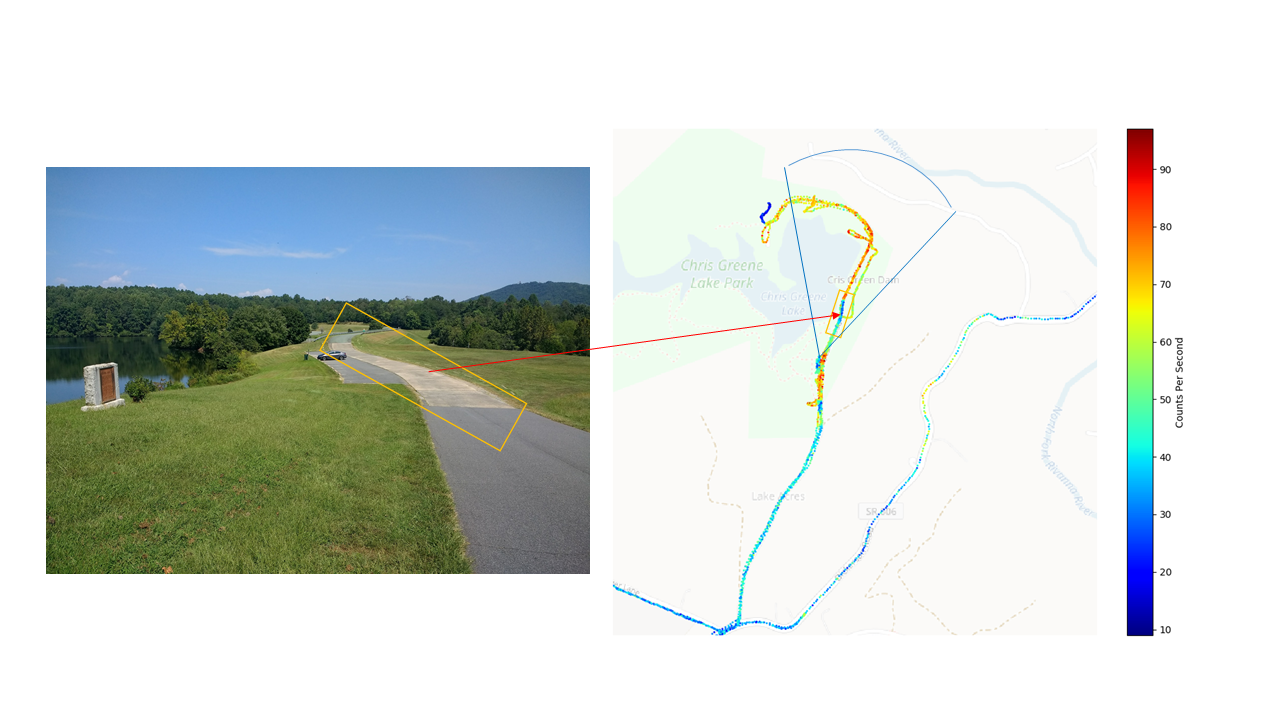
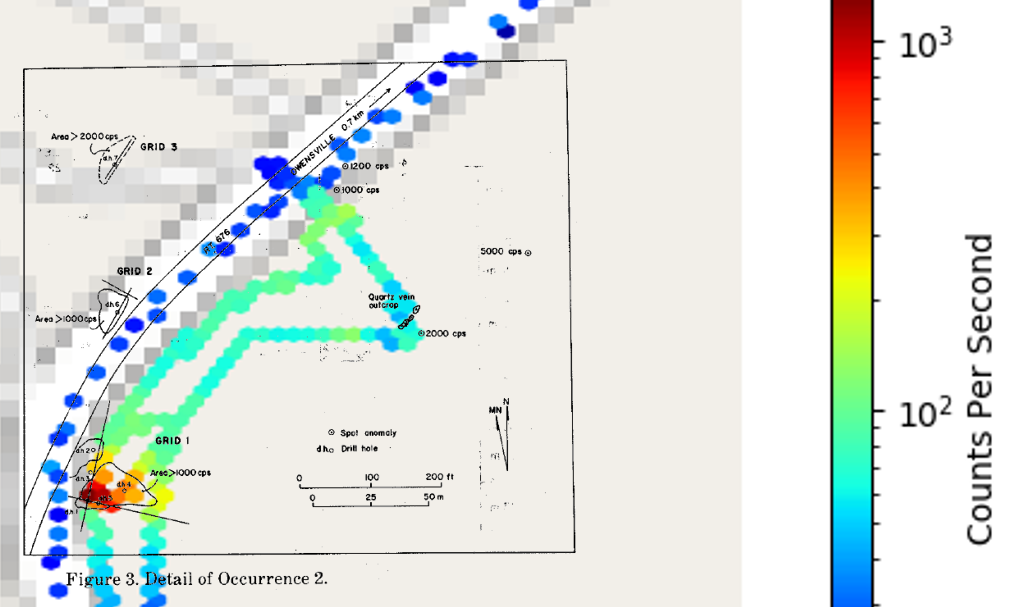
I just posted a new YouTube video about I project I’ve been working on for some time. It’s a scintillation detector coupled to a Raspberry Pi that lets you make maps of background radiation levels. You can leave it in your car as you drive around town and then upload the data over WiFi when you get home.

Here is the parts list for most of the major components:

https://www.ebay.com/usr/iradinc
3″ Diameter BC-412  – $69
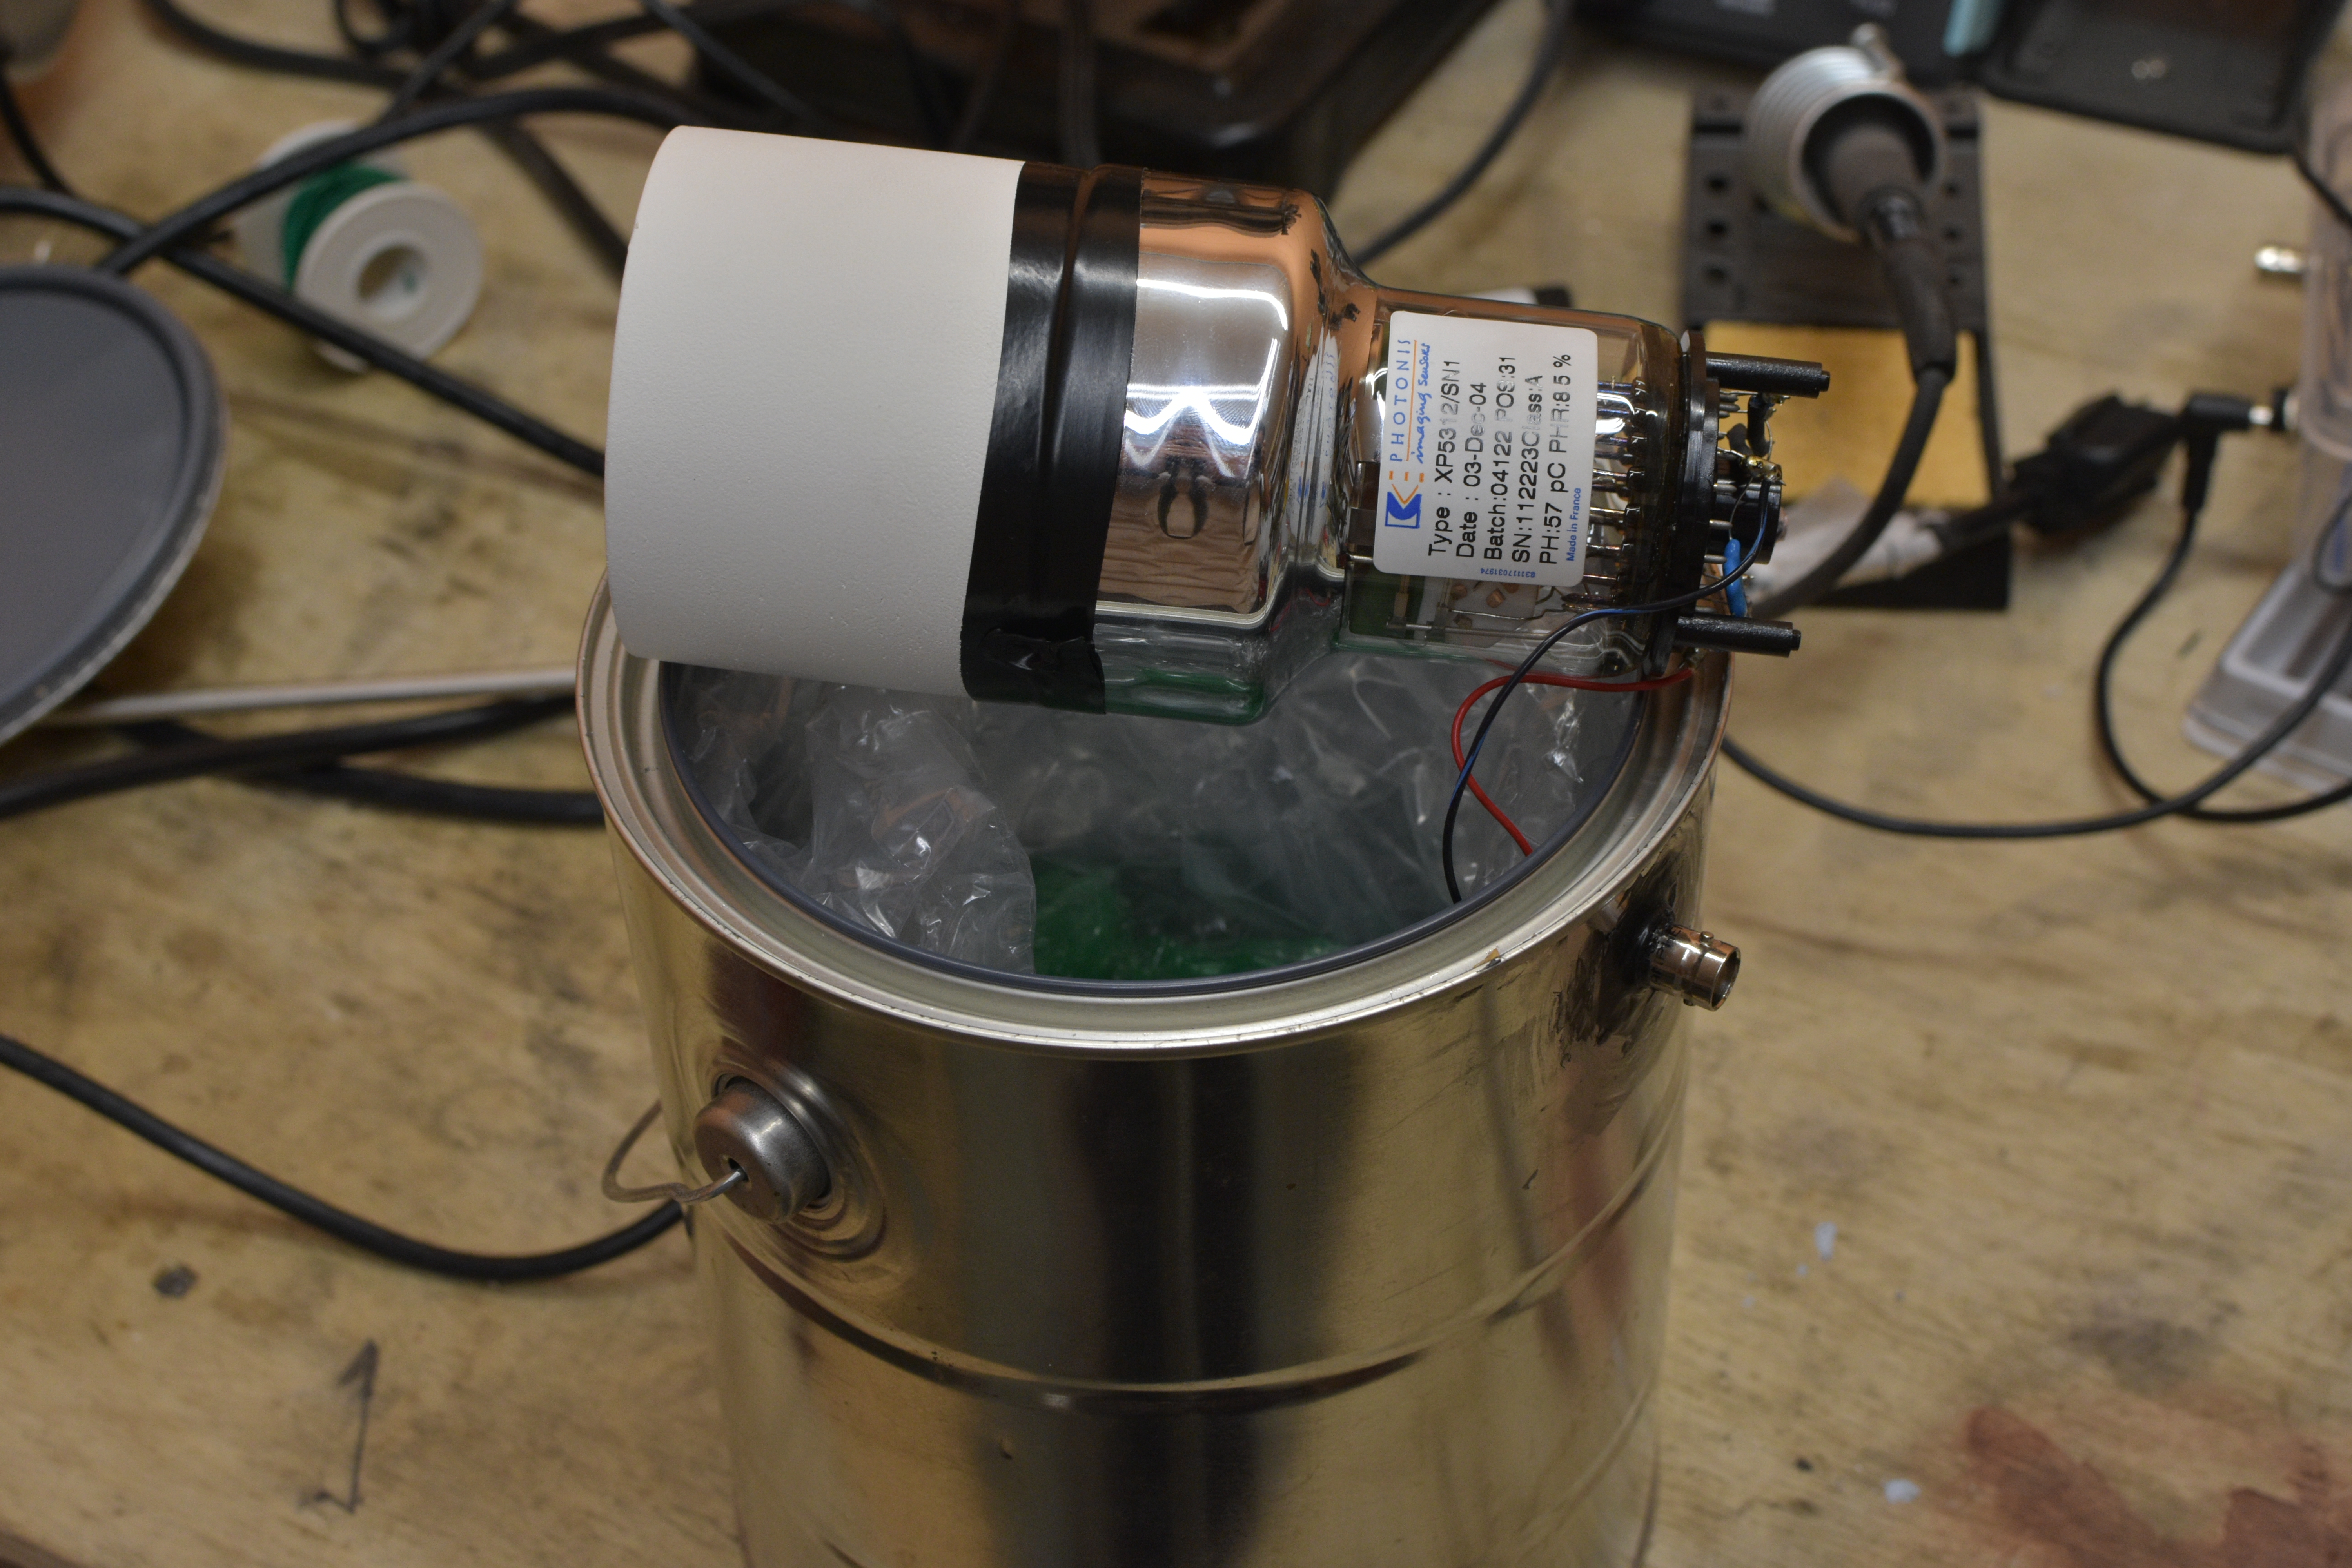
XP5312 PMT – $65

https://rhelectronics.net/store/
RH Electronics High Voltage Supply – $40
RH Electronics Counter Preamp – $30

https://www.adafruit.com/
Raspberry Pi – $35
Touchscreen – $45
Battery/UPS – $50

https://Sparkfun.com
GPS – $18 (https://www.sparkfun.com/products/13740 )

Total: $352

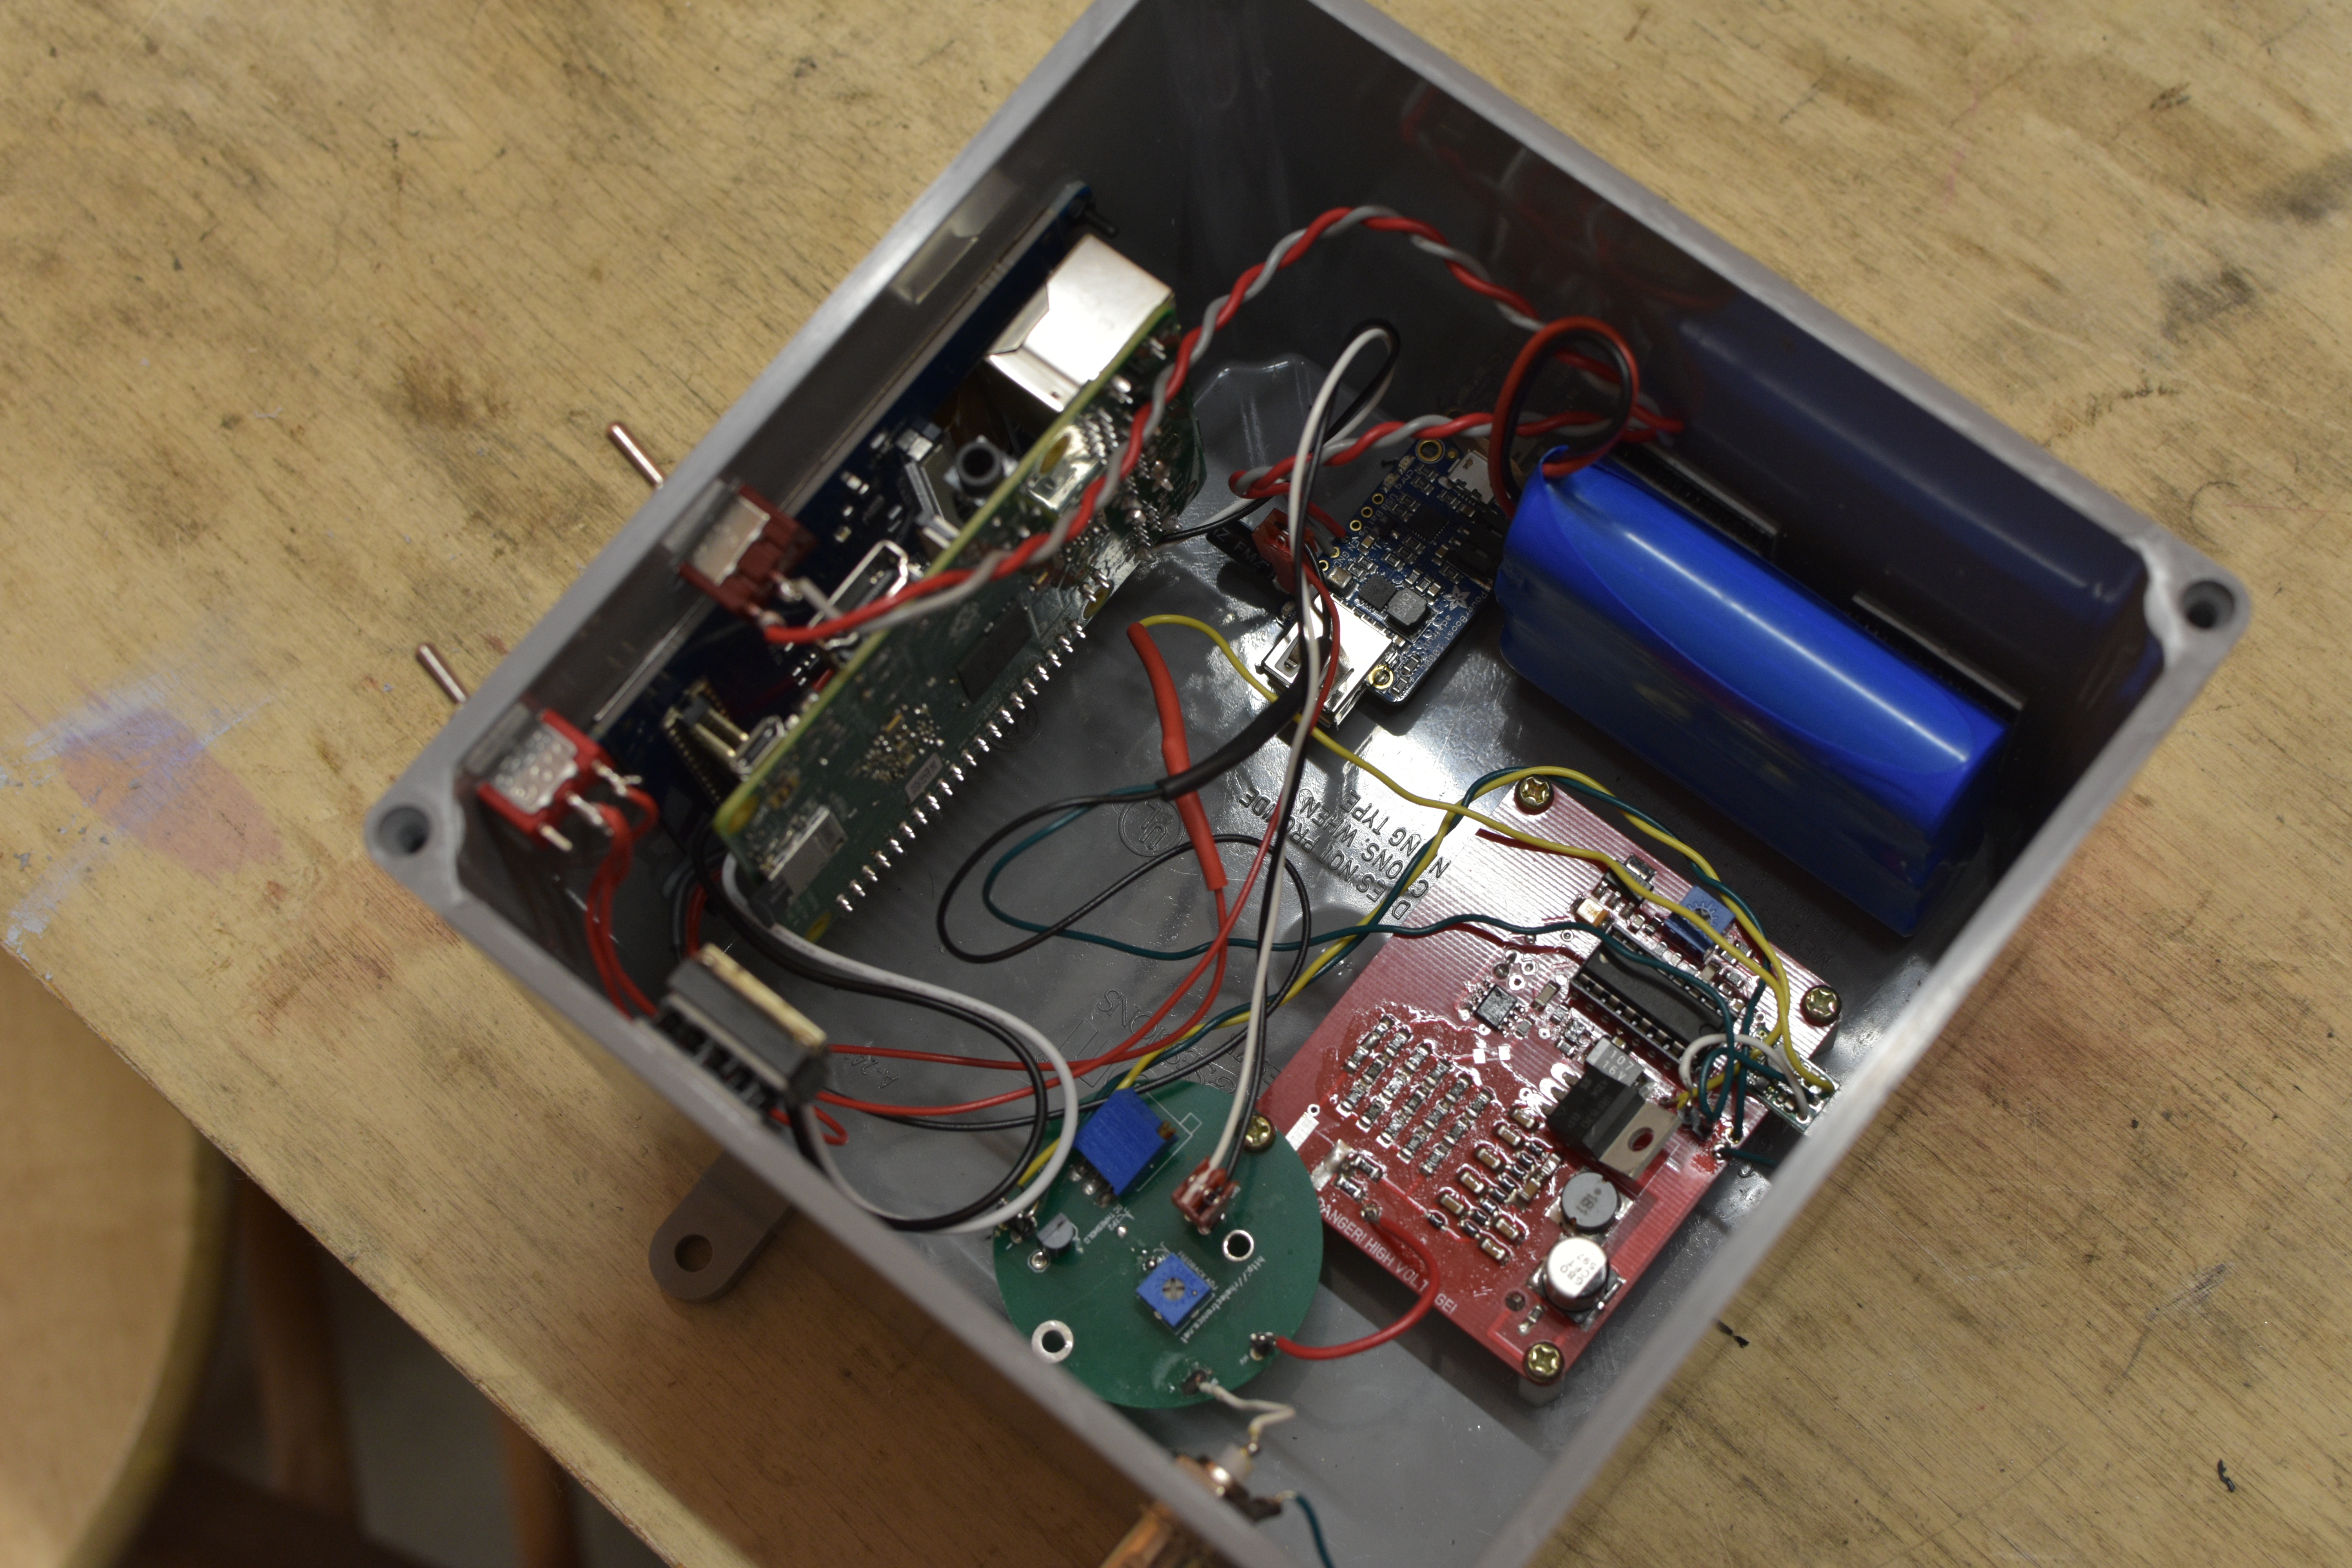
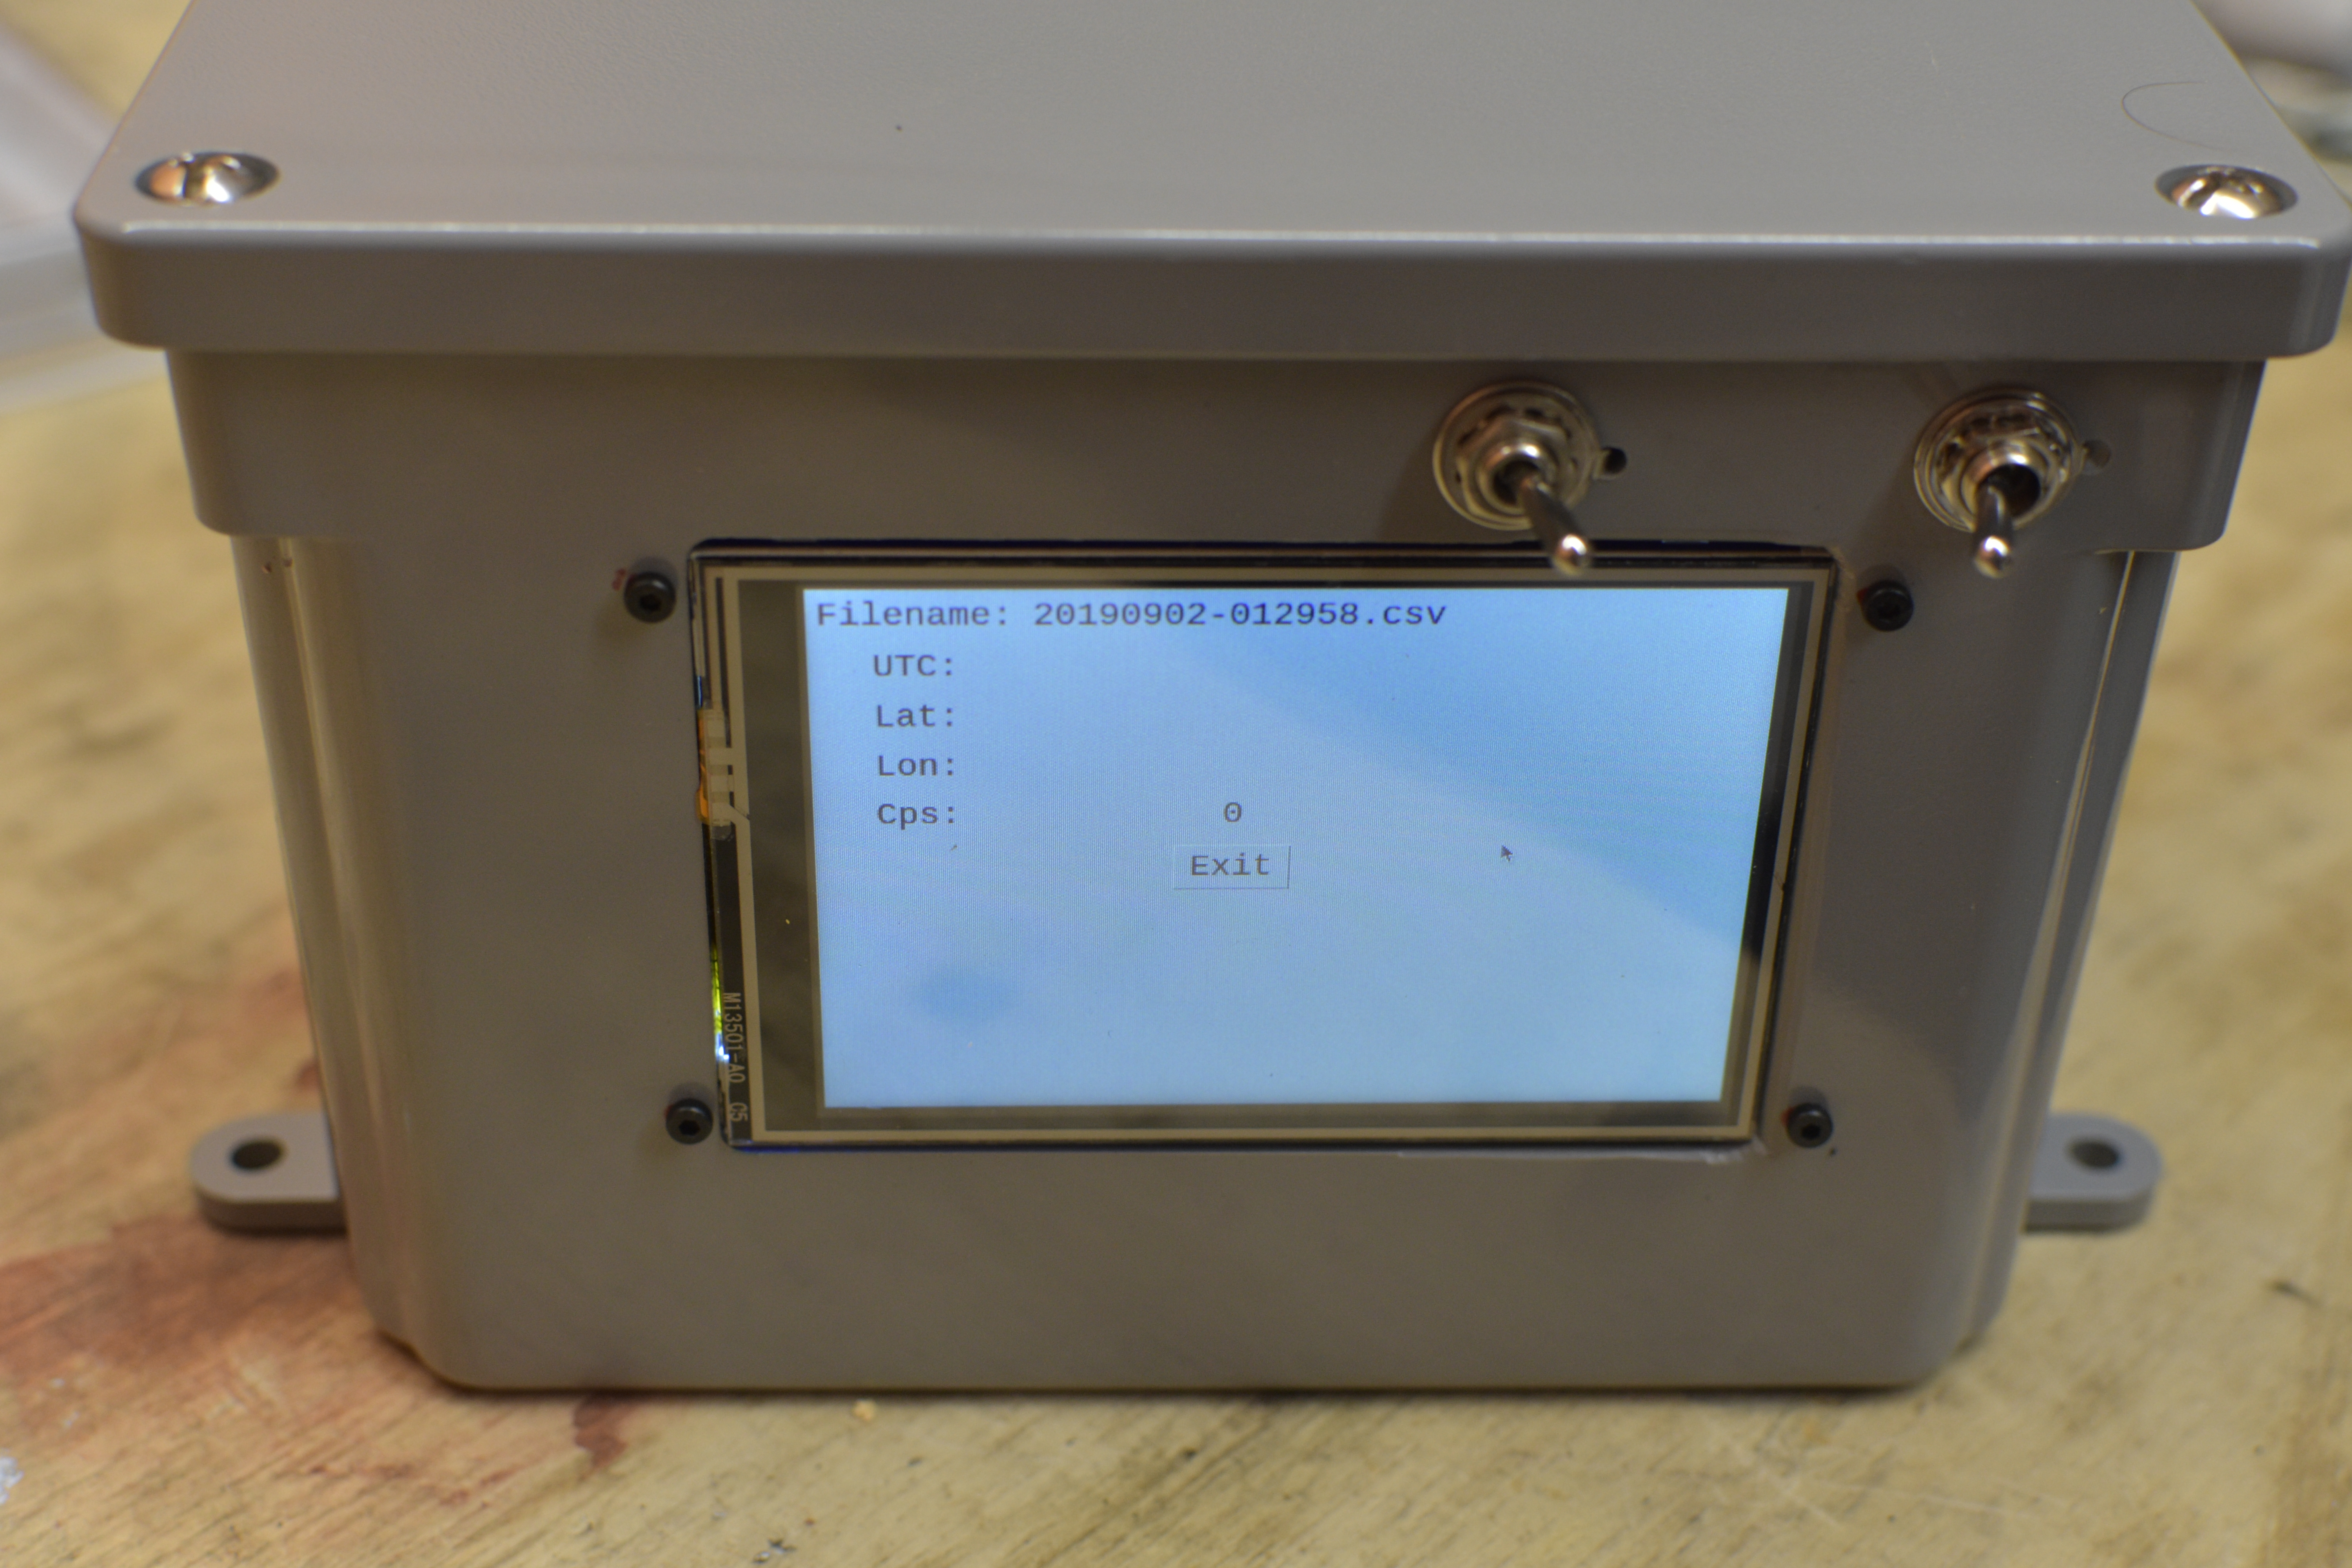
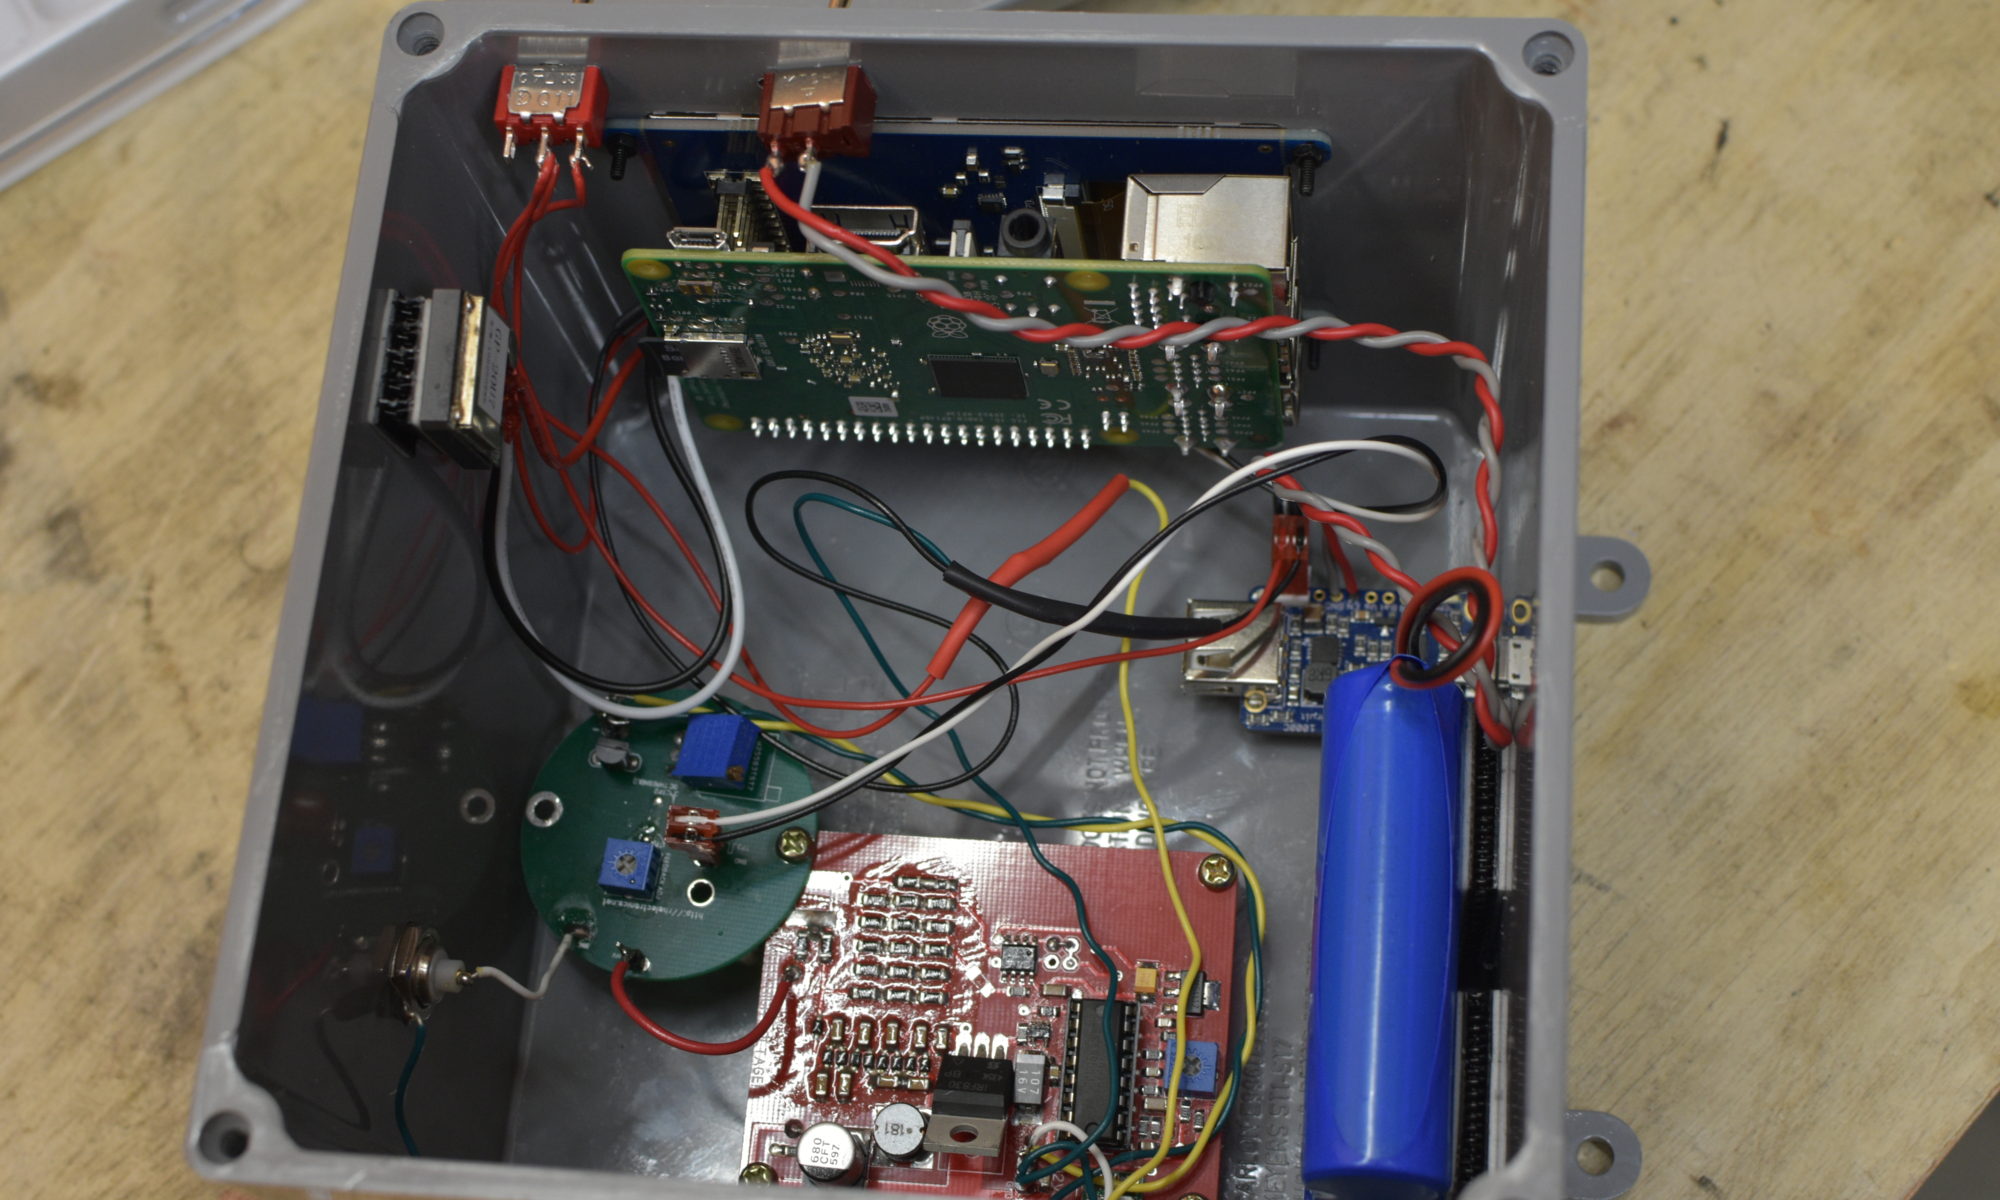
You will also need a paint can to enclose the PMT and block out all light as well as an enclosure for the electronics. I used a gray plastic electrical box I picked up at Lowes.

I have a GitHub repository with the code for the Pi, the code to plot the data, and some data files: https://github.com/abstractspace/RADLOGGER

It is really messy, but should help you get started. The file main.py plots the csv files and counts.py file runs the GUI on the Raspberry Pi.

Currently to get the data off the Pi I let it connect to my WiFi. I then ssh into it and push the new .csv files to Git. I want to come up with a long term solution going forward that is more automated and automatically uploads the data when in range of your WiFi and then powers everything down. This would mean you could just put in in your car and pretty much forget it.

Here’s the real star of the show, a piece of BC-412 scintillation plastic coupled to a photomultiplier tube. The bubble wrap in the paint can protects this delicate assembly and helps prevents any electrical shorts.
A good view of the electronics. The wiring could definitely use some improvement. It’s a little bit scary having 1.1kV wires and 5V wires so close together.
This is what the pulses look light after going through the preamp. You can see two or three of them here with different heights. The Pi can’t read these analog signals directly so you have to set the detection threshold with a potentiometer. With a different scintillating material such as NaI(Tl) (thallium-doped sodium iodide) you could do gamma spectroscopy by looking at the pulse heights. Plastic scintillators have too poor of an energy resolution to do useful gamma spectroscopy, but you can still differentiate somewhat between low and high energy photons.
This is what it looks like if you have stray light leaking into your PMT. I cracked the lid open to let in some stray light for this trace. The photons from a light leak arrive at random times so they just look like the noise floor moving up. When a gamma ray hits the scintillator it makes several hundred photons visible as a pulse above the noise floor.
The beautiful state of the art user interface. This could also use some improvement. It would be cool to show a plot of levels over the past 5 minutes and a small map of your path.
Ready to sniff out some gamma rays! Notice it is charging from the truck through the micro USB cable. This lets it run indefinitely while plugged into the vehicle.
A map I made of Charlottesville. I cut the scale off at 100cps, having the field with 2000cps included made everything else look blue.
A slightly zoomed in map showing the park with radioactive gravel.
The part of the road that was repaved with concrete has a visibly lower radiation level in the map.
Here is a map of the field I made with the map from the paper overlaid. I didn’t get a chance to check out the other hot spots in the field.